Enter your store's address—we'll show you the products where you're leaving money on the table. No registration, no installation required.


It's completely free
No strings attached, no hidden costs. You get a comprehensive price analysis based on real-time data from Google Shopping—with no obligations and no credit card required.

Your portfolio under the microscope
We analyze a representative sample of your product range and compare it with your competitors’ listings on Google Shopping. You’ll see which products give you a price advantage—and where you’re leaving profit on the table.

Transparent data
Charts, tables, product rankings. The report breaks down your product lineup into traffic-driving and revenue-generating products, and then shows how you stack up against the market in each of these categories.

Specific recommendations
This isn’t just a dry list of data. You’ll find recommendations on which products to discount, where to raise prices, and how to boost sales. We generate these suggestions using algorithms relied upon by hundreds of companies across Europe.

Your window into the competition
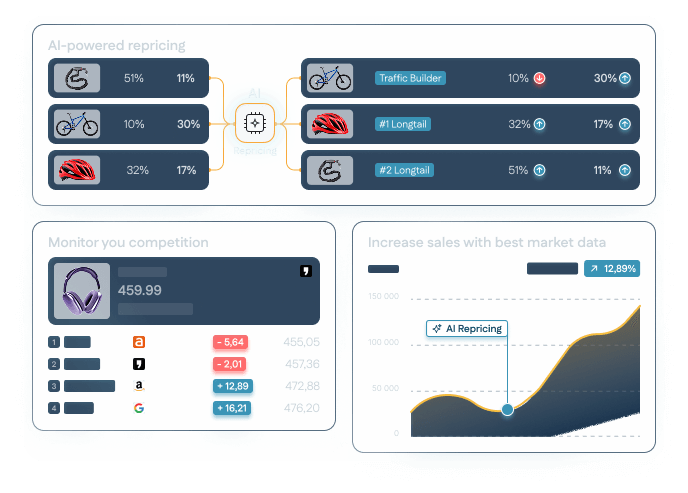
Check how your competitors are pricing their products on Google Shopping. Use this data to develop a pricing strategy that will help you rise to the top of the product listings.

Price positioning relative to the market
: See what percentage of your products are cheaper, more expensive, or priced at market rates. One chart—and you know where you stand
Product-by-product comparison:
A table showing your prices versus the competitors' lowest prices. For each product, the difference is shown in PLN and as a percentage.
Price Index and Price Ranking
The Price Index shows how much your prices deviate from the market average. Ranking — your price position on Google Shopping.
Recommendations — What to Change
: Specific Tips on Which Products to Discount, Where to Raise Prices, and How to Boost Sales on Google Shopping
80% of our users recommend our app
We use Dealavo to monitor 45 000 SKUs across Benu, Alza, Lekarna, and other key e-commerce competitors in the Czech market. The platform has reduced manual price-checking time, allowing us to focus on pricing strategy rather than data collection, and improving our response time to competitor price changes.

Dealavo provides us with a comprehensive overview of pricing for over 30,000 SKUs across European markets. Thanks to automated monitoring and reporting, our team saves many hours of manual work each month and can make data-driven decisions based on reliable market data and facts.

Using Dealavo, we monitor nearly 18,000 products on the Swiss market and keep a central eye on price trends among our key competitors, such as Galaxus. This allows us to identify market changes more quickly, automatically adjust our market share, and reduce the manual effort required for price monitoring.

Dealavo has become an important tool for our team, allowing us to efficiently monitor more than 2,500 products across multiple European markets. We particularly value the visibility it provides on key marketplaces and retailers such as Amazon and Zalando, enabling us to make informed business decisions. Beyond the platform itself, we’ve also appreciated the responsiveness of the Dealavo team and their openness to customer feedback.

Dealavo enables us to efficiently monitor around 5,000 products across Google Shopping. Thanks to its centralized price analysis, we save valuable time every day and can adapt our pricing strategy more quickly based on market data.

At Dealavo, we monitor about 800 of our brand’s products, checking prices at major online stores and marketplaces such as Allegro and Amazon. Using this data collected daily, Dealavo allows us to see real-time price changes in the market presented in a convenient, customizable format. On this scale, manually checking prices would simply be impossible.

Dealavo allows us to automatically adjust our prices dynamically based on an algorithm we’ve defined to keep pace with the competition. This enables us to consistently rank at the top and generate very strong sales through Idealo.


Since 2024, Dealavo has been part of the JTL Group. This combination of our advanced technology and JTL’s powerful ecosystem opens up new opportunities for our customers.
For you, this means the technological stability of a partner with a European footprint and access to expertise that supports tens of thousands of sellers across Europe.
We specialize in optimizing prices, distribution networks, and market strategies. We serve clients in over 30 countries, monitoring millions of products every day.
Can't find the answer you're looking for? Contact us
It’s a free pricing analysis of your store against competitors visible in Google Shopping. You provide your store’s URL and the report is generated automatically – it shows which of your products are more expensive than the market, which are cheaper, and where you’re losing margin or clicks. The report is completely free, with no hidden costs and no commitment.
For any online store selling through Google Shopping – regardless of industry. E-commerce managers, pricing specialists, Google Ads campaign managers, and store owners all use it. The report is useful whether you have a few hundred products or tens of thousands of SKUs.
Yes – the report analyzes your products in Google Shopping, so they need to be visible there. If you run Google Shopping campaigns or have products visible in Google Shopping, the report will work. If you don’t sell through Google Shopping but want to compare prices on marketplaces – check out our Bestseller Radar for Allegro or Price Monitoring.
Yes. There are no hidden costs, you don’t need a credit card, and you don’t sign a contract. You get a full report with data – no “lite” or trimmed version. It’s our way of showing you the quality of Dealavo’s data before you commit to ongoing monitoring.
Google Merchant Center shows your products and their feed status. Dealavo’s report shows your prices vs. the prices of all visible competitors in Google Shopping – with store names, prices per SKU, a price index, and recommendations. GMC says “your product is active.” Dealavo says “your product is 12% more expensive than the cheapest offer in Google Shopping, and here’s who’s cheaper and by how much.”
The Google Shopping report analyzes your store against competitors – it compares your prices with market prices and shows where you’re losing margin or clicks. Bestseller Radar for Allegro is an interactive dashboard showing what’s selling on Allegro (bestsellers, brand shares, product gaps). The Radar is a market exploration tool. The GS report is a tool for optimizing your prices.
Instantly. You provide your store’s URL and the report is generated automatically within seconds.
Two files. Executive Summary: your store’s price index (how you compare vs. the market), share of products more expensive and cheaper than competitors, TOP products with the highest pricing potential, and recommendations. Raw Offers: detailed data per SKU – your price, each visible competitor’s price, the difference in your currency and percentages, and the competitor store name.
From publicly available offers in Google Shopping. Dealavo collects data from all visible offers for each of your products – the same data any Google user sees. Matching is based on EAN/GTIN codes.
Above 99% product matching accuracy. We use EAN/GTIN codes for precise matching – same product, same variant, same package size. If a product doesn’t have an EAN code or isn’t visible in Google Shopping, it won’t appear in the report – we prefer a missing product over a wrong match.
As many of your products as are visible in Google Shopping. There’s no upper limit – the more products, the fuller the picture of your pricing position. We’ve analyzed stores from 800 to 45,000 SKUs.
The price index is the ratio of your prices to the market average in Google Shopping. An index of 100 = you’re at market level. An index of 95 = you’re 5% cheaper. An index of 108 = you’re 8% more expensive. It lets you quickly assess whether your pricing policy matches your intent – and where you have products that are unnecessarily cheap or expensive.
Yes. You’ll see store names, their prices per product, and how your price compares to each of them. It’s not an anonymous analysis – you see exactly who charges what for the same product.
The report divides your products into three pricing roles. Traffic Builders – products where you’re cheaper than the market; they generate clicks and traffic. Basket Builders – products at market price; they generate cart additions. Long-tail – products where you’re more expensive than the market; they have lower conversion in Google Shopping. Knowing these roles, you can set different bid strategies in your Google Ads campaigns.
Yes. The report identifies which products are worth repricing (because you’re significantly more expensive and losing clicks), which are worth raising (because you’re cheaper than everyone and leaving margin on the table), and which are fine (market price). Recommendations are per SKU, with amounts in your local currency.
Two files: Executive Summary in XLSX (summary with charts and KPIs) and Raw Offers in XLSX/CSV (detailed data per SKU). Both open in Excel or Google Sheets.
Three ways. First: increase bids on Traffic Builders (products cheaper than the market – they have high conversion). Second: lower bids or exclude products where you’re 20%+ more expensive than the cheapest offer – you’re paying for clicks that don’t convert. Third: check whether your campaign bestsellers are competitively priced – if not, a price change will deliver better ROAS than a bid change.
The report shows products where you’re cheaper than every competitor. These products sell regardless of price – customers buy from you because of brand, delivery, or availability. Raising their price to market level won’t reduce sales but will increase margin. Many of our clients find dozens to hundreds of such products in the report.
Yes. The report shows at what price your competitors sell your products. If you see that retailers in your channel are selling below the suggested price – you have hard data for a conversation with your supplier or distributor. Manufacturers use the report to verify MAP/MSRP compliance in the Google Shopping channel.
Yes. You can order the report for different European markets and compare where your prices are competitive and where they’re not. If you’re 15% cheaper than average in Germany but 10% more expensive in France – you know where it’s easier to enter with your current pricing policy.
As a one-off – it’s enough to get a snapshot of your pricing position. Before Black Friday, before entering a new market, before changing your pricing policy. If you want to track prices daily – that’s what our full Price Monitoring does, updating data every day.
Yes. By ordering the report a few weeks before Black Friday, you’ll see how you’re positioned price-wise before the promotional season. You’ll know which products are already competitive (no need to discount them) and which need adjustment so you’re not burning ad budget on products priced above the market.
Yes. The report analyzes Google Shopping data in any European market – Poland, Germany, Austria, France, the Netherlands, Czechia, Romania, the United Kingdom, and others. Specify the country when ordering. You can order reports for multiple markets at once.
The report is a snapshot – it shows the state at the moment of analysis. If you want to track competitor price changes daily, get alerts, and automatically adjust prices – upgrade to full Dealavo Price Monitoring. Your account can be up and running within 24 hours.
Yes. You can set up recurring report generation – weekly, monthly, or quarterly. It’s an alternative to continuous monitoring if you need periodic pricing reviews rather than daily data.
Use the contact form on our website or click “Order report.” We respond within 24 hours. If you have questions about interpreting the report – our team will help you draw insights from the data.
Our system retrieves price data from Google Shopping for the products in your feed. We compare your prices with those of your competitors, calculate a price index, and generate a report with charts, tables, and recommendations. The entire process is automated-all you need to do is provide your store’s URL.
Ready to change your pricing strategy?

Join the hundreds of companies that are already using Dealavo to optimize their prices and boost their profits.


