Everything you need to know about e-commerce analytics
- 15 October 2021
How can you create the perfect e-commerce business? Are elements like legible layout, intuitive operating, and vast inventory sufficient? These aspects are, of course, of paramount importance, but frequently, the list of your must-haves is much longer. That’s why e-commerce analytics is so important. In this article, we will show you how and why you should track traffic on your website and what factors you ought to measure in order to grow your business efficiently. We will also suggest some tools you can use to achieve this goal.
Building an online store is nothing more than an attempt to walk in your customers’ shoes – to understand their problems and needs. Successful e-commerce businesses continually listen to their customers’ voices and adjust their offers and campaigns accordingly. The whole e-commerce sector is in constant movement. If you don’t develop your store and offer, quickly you will be surpassed by your competition.
E-commerce analytics
The success of every online endeavor starts with analytics. Only when you know your customers and their needs can you create an online store that gets recognition.
According to research conducted by MarketingSignals, the failure rate in e-commerce is very high and stands at 90% after just 120 days of operation[1] (data from 2019)! You can avoid this scenario by implementing decent e-commerce analytics.
Having a thorough knowledge regarding the market you operate on and your customers and their needs, you will be able to:
- Refine your offer
- Plan effective promotions and marketing campaigns
- Accurately select products in your offer
As a result, you will lower the risk of failure. Let’s get down to business, then. What should you focus on in your e-commerce endeavor?
TAKE GOOD CARE OF UX
In the e-commerce world, it all comes down to user experience. If your customers aren’t satisfied with the way your store looks and works, they will leave you in no time. Again, here, analytics is indispensable. If you discover that your website is visited rarely and shortly, it’s a clear signal you need a solid remodeling.
The biggest online stores track every move of their customers. Which button did they click and when? Did they go to the cart section? How much time did it take them to finish placing an order? How many users did not finish their orders? What products are the most popular ones?
This way, they can quickly discern when something alarming happens, and the intervention is needed. For instance, if the number of incomplete orders drastically rises in a short time, this probably means there is some technical issue that needs addressing immediately.
MONITOR YOUR COMPETITION
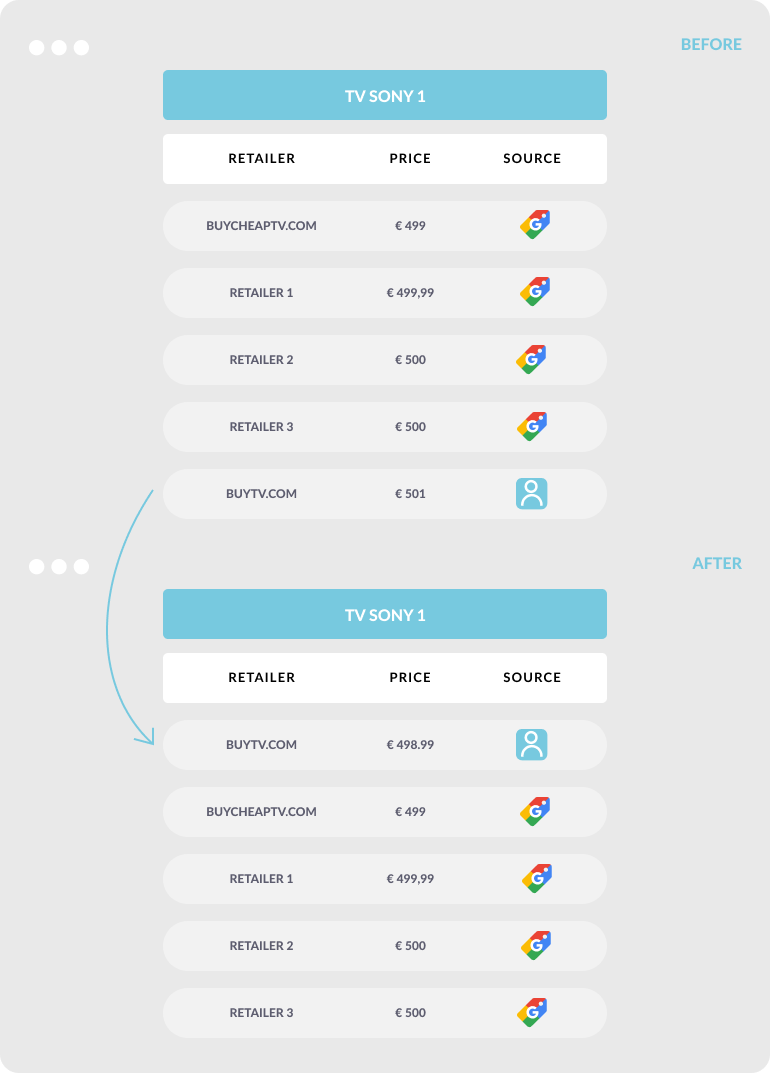
You should track everything that happens in your store but on the market, too. Today, every e-commerce business has vast and fierce competition. You have to be aware of your competitor’s actions. Tools like Ahrefs and Senuto will give you some insight into their strategy, e.g., concerning used keywords. And our competitor price tracking and monitoring tool will allow you to monitor prices offered by your competitors, as well as their assortment and market position. In many instances, it can turn out that a slight price change can result in a significant change in your position on the market. Take a look at how changing price by just 2 EUR allowed this company to reach no. 1:

Find out more about tracking prices: What is a price checker (price monitoring tool), and how to choose the right one?
TRAFFIC ON YOUR WEBSITE
It’s always your starting point. You have to analyze your customers’ activity continually. It’s especially important to track how and for how long they browse your website. Which sections do they visit? What are their queries? What additional actions do they take? Precise information on that will enable you to discover all the advantages and disadvantages of your store.
How can you track traffic on your website? You have lots of tools at your disposal, but the most popular one is Google Analytics. The Mountain View’s giant solution is not only accurate but also free (in the basic version). Thanks to Google Analytics, you can analyze the profile of your customers (including demographic data, used devices, and traffic sources) and their behavior.
CONVERSION RATE
Take care of conversions as well. Of course, in the e-commerce world, the most important type of conversion is placing an order, but that’s not the only one you should track. Others comprise:
- Signing up for a loyalty program
- Signing up for a newsletter
- Increasing the AOV index (average order value)
- Growing sales of the high-margin products, and others
How can you calculate the conversion rate? By dividing the number of conversions by the number of users visiting your website in the given period (month/year). If, for example, 120 users visited your store this month and 18 placed an order, your CR is 18 / 120 x 100% = 15%. Of course, the higher CR, the better.
If you see that traffic or conversion drops, you have to find out what’s causing this adverse trend. In some situations, this can be an effect of changes in prices on the market. That’s why it’s so vital to measure prices continually.

BOUNCE RATE
This index informs you how many users have entered and left your website without taking additional action (e.g., without placing an order or visiting more subpages). There are lots of elements that can influence the bounce rate, from poor layout (if your website is not intuitive to use, users won’t feel encouraged to spend more time on it), through errors, up to a lengthy load time (bear in mind that Google’s latest guidelines mention loading time between 2.5 and 4 seconds). How can you calculate the bounce rate? Similarly as in the case of CR: If for 100 people visiting your store 20 leaves without taking any action, your bounce rate is at 20%.
CUSTOMER LIFETIME VALUE (CLV) AND RETENTION RATE (RR)
These two indicators are tightly connected and are designed to show how long your customers stay with you and how much money you will make on them during that period. The RR index is a percentage value, and you can calculate it for each month by dividing the number of customers that left by their initial number.
On the other hand, calculating CLV is much more complicated and can be done in many different ways. Today, we want to show you the way proposed by Shopify[3]:
- Calculate AOV (sales divided by the number of orders)
- Calculate purchase frequency (total orders divided by total customers)
- Multiply AOV by purchase frequency. This way, you will get customer value.
- Check for how long customers stay with you (analyze historical data). On average, they stay with one store for one to three years. Multiply the average time by customer value. This way, you will get the CLV index.
CUSTOMER ACQUISITION COST/COST PER ACQUISITION
You can quickly calculate this cost by dividing expenses for customer acquisition (sales + marketing) by the number of customers in a given period. Again, let’s use a straightforward example. Suppose you spent 6,000 USD to promote your store this month. You managed to get 230 customers. Now divide 6,000 by 230, and you will get the CAC index, which in this case is almost exactly 26 USD. If your customers spend more per person than CAC and more than the cost of the product they bought, you make money on each such person.
We encourage you to check our tools for e-shops and see how Dealavo can help you achieve and maintain high visibility on the market and sometimes even increase profit margins.
[1] https://smallbiztrends.com/2019/07/why-ecommerce-fails.html
[2] https://web.dev/lcp/
[3] https://www.shopify.com/blog/customer-lifetime-value