Competition on Google Shopping vs Ceneo: Dealavo Report
- 25 March 2021
Ceneo and Google Shopping are undoubtedly one of the most popular e-commerce platforms in Poland. In the past, retailers focused primarily on making their products available on Ceneo – this was because of the high popularity of the Polish comparison platform with the consumers. Nowadays, however, it has become common to check out offers on Google Shopping, where the results are shown directly in the browser. This has caused more retailers to advertise their products on this platform. Based on data concerning 39,508 products (classified into the following categories: “Office supplies”, “Electronic goods”, “Cosmetics”, “Food and dietary supplements”, “Pet goods” and “Other”), Dealavo analysts have compared the prices and competition on both platforms. The survey was conducted using data from the Polish market from March 2021.
Average prices on Google Shopping vs Ceneo
Based on data for 39,508 products (1,304,737 offers), the Dealavo team checked how often the average product price was higher on each platform. It turns out that, on average, the average price on Google Shopping was higher than the price on Ceneo in 69.9% of cases. This trend could be observed in all of the identified sectors:
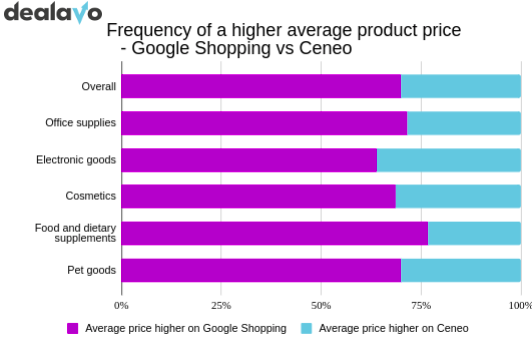
However, the average difference in average product price on both price comparison platforms is not high. The price level on Google Shopping is 2.48% higher on average in comparison with Ceneo. This trend could be observed in most sectors – the average prices were higher on Google Shopping for the following categories:
-
Food and dietary supplements (average difference: 3.05%)
-
Cosmetics (average difference: 2.98%)
-
Office supplies (average difference: 1.64%)
-
Electronic goods (average difference: 0.18%)
The only analysed category where the products were, on average, more expensive on Ceneo than on Google Shopping were pet goods (difference: 1.8%).
The cheapest offer – on Ceneo or Google Shopping?
Dealavo analysts also analysed how frequently the consumers were able to find the cheapest offer on each platform. As it turns out, generally, the most attractive offer was available at the same price on both platforms:
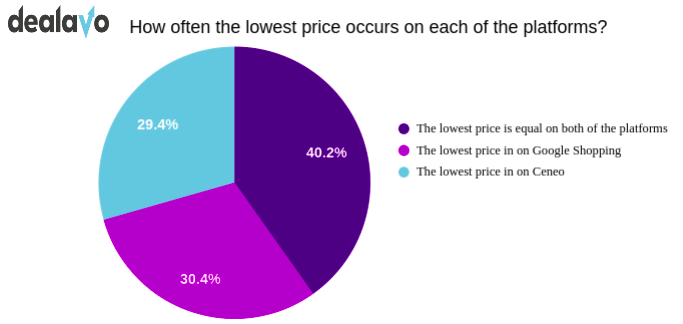
As shown by the chart above, for 40.2% of the products, the lowest price was the same on Google Shopping and Ceneo. The second most frequent situation was that a more attractive offer could be found on Google Shopping (30.4% of SKUs), and the least frequent case was that the cheapest offer was available on Ceneo (29.4% of the goods).
That is largely because the Google Shopping comparison platform frequently also includes offers from Ceneo in its ranking.
Competition among retailers on Google Shopping vs Ceneo
The Dealavo analysts have also analysed how competitive the two platforms were. The purpose of this was to verify the hypothesis that Polish online shops competed more fervently on Ceneo than Google Shopping. Two measures were used:
-
Average number of offers per product,
-
Standard deviation from the average price on a particular platform. The variable shows how much the offered prices are clustered around the average (i.e., in simple terms, a low standard deviation means that the retailers offer their products at similar prices).
It was assumed that higher deviation (more varied prices) meant that the particular platform was less competitive. That is because the pricing strategy of the shops is not aimed at keeping their prices on a level similar to their competition (the shops tolerate higher discrepancies between their own offers and the offers of their competitors).
Average number of offers – Google Shopping vs Ceneo
Based on an analysis of more than one million offers, the average number of offers on Google Shopping PL is 18, and on Ceneo – 15. This means that consumers can compare proposals from a larger number of online shops on the platform of the US giant.
Another analysed aspect was the frequency with which a higher number of offers could be found on Google Shopping. As it turns out, this occurred for 59.3% of the products. A larger number of offers could be found on Ceneo for 24.4% of the products, and for 16.3% of the SKUs the number of offers was the same on both platforms.
Interestingly, the number of available offers on the analysed platforms varies depending on the price segment. The products were broken down as follows:
-
Less expensive products (up to PLN 100)
-
More expensive products (more than PLN 100).
In the case of the lower price range, more offers could be found on Google Shopping for 64.6% of the products. The situation is different for products costing more than PLN 100 – the number of offers (and, consequently, competition) was higher on Google Shopping only for 37.1% of the products. In the case of more expensive products, it was also quite common for both platforms to have the same number of offers (this occurred in 25.4% of cases).
There were also differences between the individual sectors. The details are given in the table below:
Average number of offers per sector:
|
Higher number of offers on Google Shopping |
Higher number of offers on Ceneo |
The same number of offers on both platforms |
|
|
Overall |
59.3% |
24.4% |
16.3% |
|
Office supplies |
39.6% |
30.7% |
29.7% |
|
Electronic goods |
38.4% |
43.4% |
18.1% |
|
Cosmetics |
77.2% |
17.1% |
5.7% |
|
Food and dietary supplements |
23.5% |
58.7% |
17.8% |
|
Pet goods |
63.3% |
18.4% |
18.4% |
As can be seen, more offers on Ceneo could be found for products from the “Electronic goods” and “Food and dietary supplements” categories. For the remaining product categories, the number of offers was usually higher on Google Shopping. This means that consumers generally have a larger choice of shops where they can buy their product if they use the comparison platform of Google.
Price variability – Google Shopping vs Ceneo
What, however, is the price variability on both platforms?
This was measured by comparing the standard deviations on both platforms. In the case of Google Shopping, the average standard deviation was 17.1% (i.e. the offering of an average online shop deviated by 17.1% on average from the average product price on Google Shopping), and for Ceneo – 14.5%.
Also, for 62.6% of the products, the prices varied more on Google Shopping.
The statistics are similar for all product categories and price ranges.
As shown, the prices on Ceneo are less variable, i.e. the price range is narrower. This may be indicative of stronger competition on this platform.
As observed by Przemysław (Greg) Białokozowicz, VP Product and Services at Dealavo,
“When talking with our clients, we frequently notice retailers who focus on promoting their offering on Ceneo, disregarding the growing significance of Google Shopping. This may be why the prices are more variable on Google Shopping – the sellers place less emphasis on staying competitive in this channel. However, this is a mistake. Let’s take a look at the German market, for instance, where Google Shopping was able to successfully compete with a long-time leader – Idealo. Everything suggests that the same thing may happen in Poland. Shops that will not be ready for this will lag behind”.
Summary
The analysis indicates that, despite the growing popularity of online shops deliberately positioned on both comparison platforms – Ceneo and Google Shopping – there are significant differences both in terms of prices and their variability on the two platforms and the competition between the retailers who use them to promote their offers.
Most important conclusions:
-
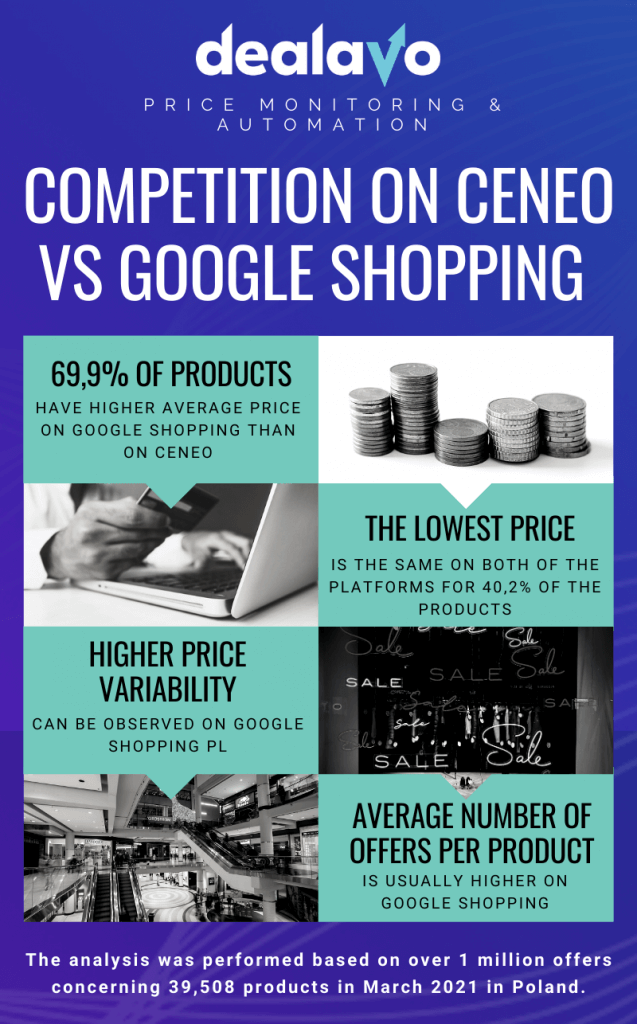
The average product price is higher on Google Shopping in 69.9% of cases;
-
The cheapest offer for a particular product is most often available at the same price on Google Shopping and Ceneo;
-
The number of offers of a single product is usually higher on Google Shopping than on Ceneo. An exception to this are products priced above PLN 100, where more offers can be found on Ceneo;
- On Google Shopping, the prices of specific products are more variable.
The report has been prepared by Dealavo. Dealavo is a provider of e-commerce analytics solutions for online shops and manufacturers. It specialises in price monitoring and automation solutions for e-shops and DPSM (Distribution, Pricing, Shelving, Merchandising) solutions for manufacturers. Dealavo offers its services on 32 markets, working with international companies as well as representatives of the local market.
Learn more about factors you should analyze when deciding about the optimal sales and promotion channels: Which products to sell and promote on the most important e-commerce platforms?