Price Index Formula – calculation of key indicator for price monitoring
- 16 May 2024
Are you looking for the strategies to increase sales in your e-commerce business? One way you can try is to monitor prices over the time and draw the thoughtful conclusions. One important concept in price analysis is Price Index Formula. If you want to know, how to get advantage of this formula, this article provides you specific tips how to use this critical formula.
What is a price formula index?
The price index formula is a metric that measures the position of a store’s price offer compared to its competitors.
Using a price index allows determining the appropriate price ceiling for products — one that will be lower than the competition, while still providing a reasonable profit. After all, a price should be a factor that drives demand, but also allows the company to get revenue growth.
When we start calculating the price index, a key step is to accurately understand the competitors’ price list. This is the first step that you need to take when calculating the price index formula.
When you calculate price index, you need two kinds of data:
- The price of a given product (or some products from a specific category);
- The price of the same product in your competitor’s store;
Using a price index formula can be particularly useful when you observe decline in sales within a specific period (week, month, or year).
It is worth to mention that calculating price index can be especially important when you’re going to raise prices in your store.
When you discover that your prices are significantly lower than your competitors’, you can experiment with controlled price increases. The goal of this approach is finding the optimal point, where you improve your profit margins while still maintaining a lower price position compared to competitors.
Calculation of the price index for a single product
When you want to calculate the price index for a single product, the task is trivial. You can even calculate it on a piece of paper, using simple calculations.
The calculation can seem to be a bit harder once you calculate the price index for multiple stores. You add the price indices in the numerous, and divide the resulting number by the piece of your product.

How to analyse price index?
Once you have calculated the price index using the above method, you face the question: how to interpret the results. You should have a look into below description:
- When the price index is above 100 it means that the prices of your products are higher than those at competitors’ store;
- When price index equals 100, it means you have the same level of price;
- Number lower than 100 is good news for you. Your prices are lower than at your competitors’;
It’s a great, when you can get result below 100, but now the issue of business arises. There is no sense, to have the most customers, if your margin is far from the level that ensure profitability.
Practical support for price index formula calculation
To get accurate data, you need access to current market prices — both from your own store and your competitors. To be honest, manual checking the prices is a nightmare. For this reason, companies reach for the tools that automate price management. One of such apps is Dealavo — software that constantly monitors prices in online stores and collect them in a database.
As a Dealavo user, you can continuously analyse the current prices to precisely calculate price index formula. Gathering the data using advanced software has another significant advantage — we mean the feature that allows you to scan prices not only in online stores, but also on popular marketplaces.
All above-mentioned features make results of any price analyses are precise and reflect actual market situations.
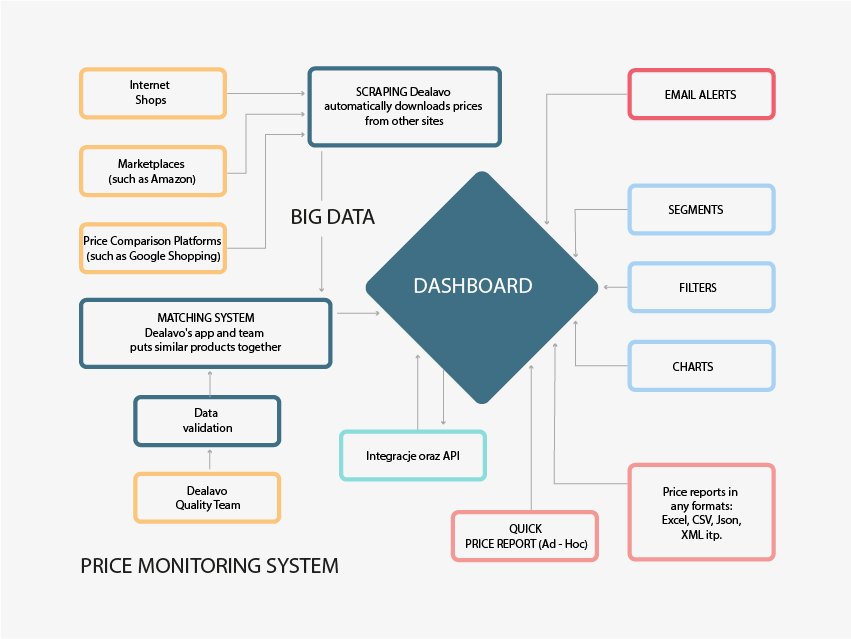
In fact, calculating a price index without access to current and complete price data makes no sense. Automating this process based on advanced tools is a key to getting reliable results.
Is calculating the price index formula worth the effort?
You may wonder if conducting this kind of calculation is genuinely beneficial for your business. In the following two sections of this article, we will highlight two significant advantages of price index calculation.
Starting point for competition analysis
Consider the following scenario: you calculate the price index for the products in your shop and those in your main competitor’s shop. The calculation reveals that your competitor’s price index is significantly lower than yours. These findings provide you a foundation for investigating the reasons behind this disparity.
It is now worth considering a few questions:
- Can you negotiate more favourable terms with your supplier?
- How much can you reduce the product price while still maintaining a satisfactory profit?
Historical data as a basis for working on sales growth
Let’s consider another example. Suppose you calculate the price index for your products and those of your competitors. You notice that while your sales have generally been satisfactory, then have short of expectations during certain periods.
You can then investigate whether your competitors offered discounts and promos during those times, which would have made their offerings more attractive compared to yours.
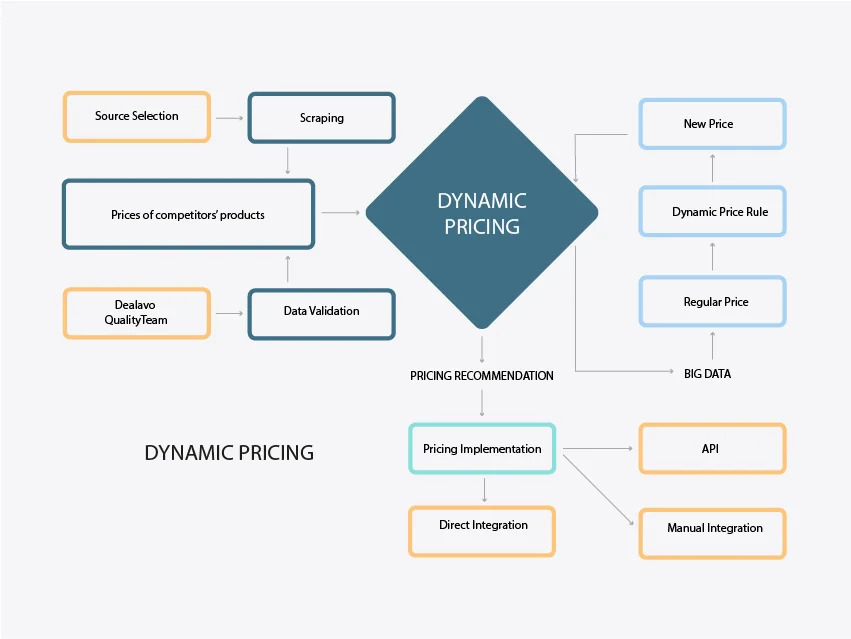
To better respond to similar promotional activities by other companies in the future, tools like Dealavo can be invaluable. When a competitor reduces their prices, Dealavo will automatically and immediately adjust your product prices in response.
It is worth to go beyond price index formula
The price index is not the only useful indicator when enhancing an online shop’s pricing strategy. Below, we indicate another valuable economic tool that can assist in planning the pricing strategy while considering your competitors’ price lists.
Laspeyres Formula
While the primary purpose of using this indicator is to measure inflation, it is also using for price monitoring in e-commerce. This formula allows price trends understanding in the market and is useful when analysing competitors’ prices.
In order to use Laspeyres formula, start by assessing the prices of the products you are interested in on a given day. Then, compare these prices with those from a past date you are interested.
Then, do the same comparison for the same products in your competitors’ shops. Check their current prices and then the prices from the same past data you used for your own shop’s analysis.
This process will show you the dynamics of price changes in both shops. Based on this comparison, you can draw conclusions about changes in sales.
At this stage, price automation tools are very desirable. With Dealavo you can easily obtain all the necessary data for the Laspeyres formula calculation — all this process take a moment.
This software simplifies price management. You only need to analyse the dynamics of price changes in your shop and those of your competitors.
Price index for product categories
As we mentioned before, price positioning and the price index are worth considering in relation to each of the product categories. This is because it may be that some elements of the offer are particularly attractive to consumers, while in other categories the brand is relatively expensive. For example, an electronics manufacturer may offer mid-priced laptops while manufactured phones are priced exceptionally low. It’s worth taking such elements into account, e.g. when building a consistent marketing message.
In the Dealavo app, the price index can be checked in the “Segments” tab. Users of the price monitoring tool can define the product categories they want to track their price positioning for. In the form of clear graphs they also receive information about:
- how the prices in a given product category differ in comparison to each of the analyzed competitors,
- availability of products in particular categories,
- historical changes in price positioning.
An interesting solution is also the analysis of your brand’s positioning across your clients (retailers). If you choose this option, the Segments tab will give you an overview of the market situation for particular groups of products. For each segment created by you you can check for example:
- availability of the products assigned to created labels at the particular retailers,
- percentage differences in reference to RRP for chosen product labels at particular retailers,
- history of changes introduced by the retailers for particular product labels.
To learn more about our offer, please contact us.
Price positioning from the e-commerce perspective
Although this article is mainly for producers and manufacturers, this doesn’t mean that online stores shouldn’t be interested in price positioning. However, things look a bit different here, primarily because producers and brands compare prices of different products (substitutes, competitive products), and online stores compare prices of the same product (offered by many merchants). In both situations, Dealavo’s solution comes in handy.
In many instances, price monitoring is a good way to get more information coming from the market and your offer. For example, it may turn out that you can get ahead of your competition by lowering your prices by just 0.5%. With our price monitoring, you can easily check your price positioning for every product, but also for every competitor. This way, you can verify what products your offer are cheaper/more expensive compared to your competitors.
Online stores can also take advantage of the Segments tab offered by Dealavo. In a clear form, they will then receive information about price positioning of their online store in each relevant product category in relation to each of their competitors, as well as a comparison of in-store availability. For each segment created, you can check:
- availability status of the selected groups of products at given competitors,
- percentage differences in prices relative to your product price or retailer prices for selected product groups,
- historical competitor behavior on selected groups of products.
Order a free online shop analysis
If you run an online store and want to see a sample of our possibilities, order a 100% free Shop Analysis Report. With our report, you can find out:
- Is your online shop competitive?
- Who is your cheapest competitor?
- How large is the market you’re operating in?
- Can you increase your profits?
All you have to do is fill in our contact form and upload an XML or XLS file with the list of products (up to 500 EAN codes). In return, we will send the report with information about the selected products to your e-mail address within 24h (on business days). If you have any doubts – you can simply contact us:


